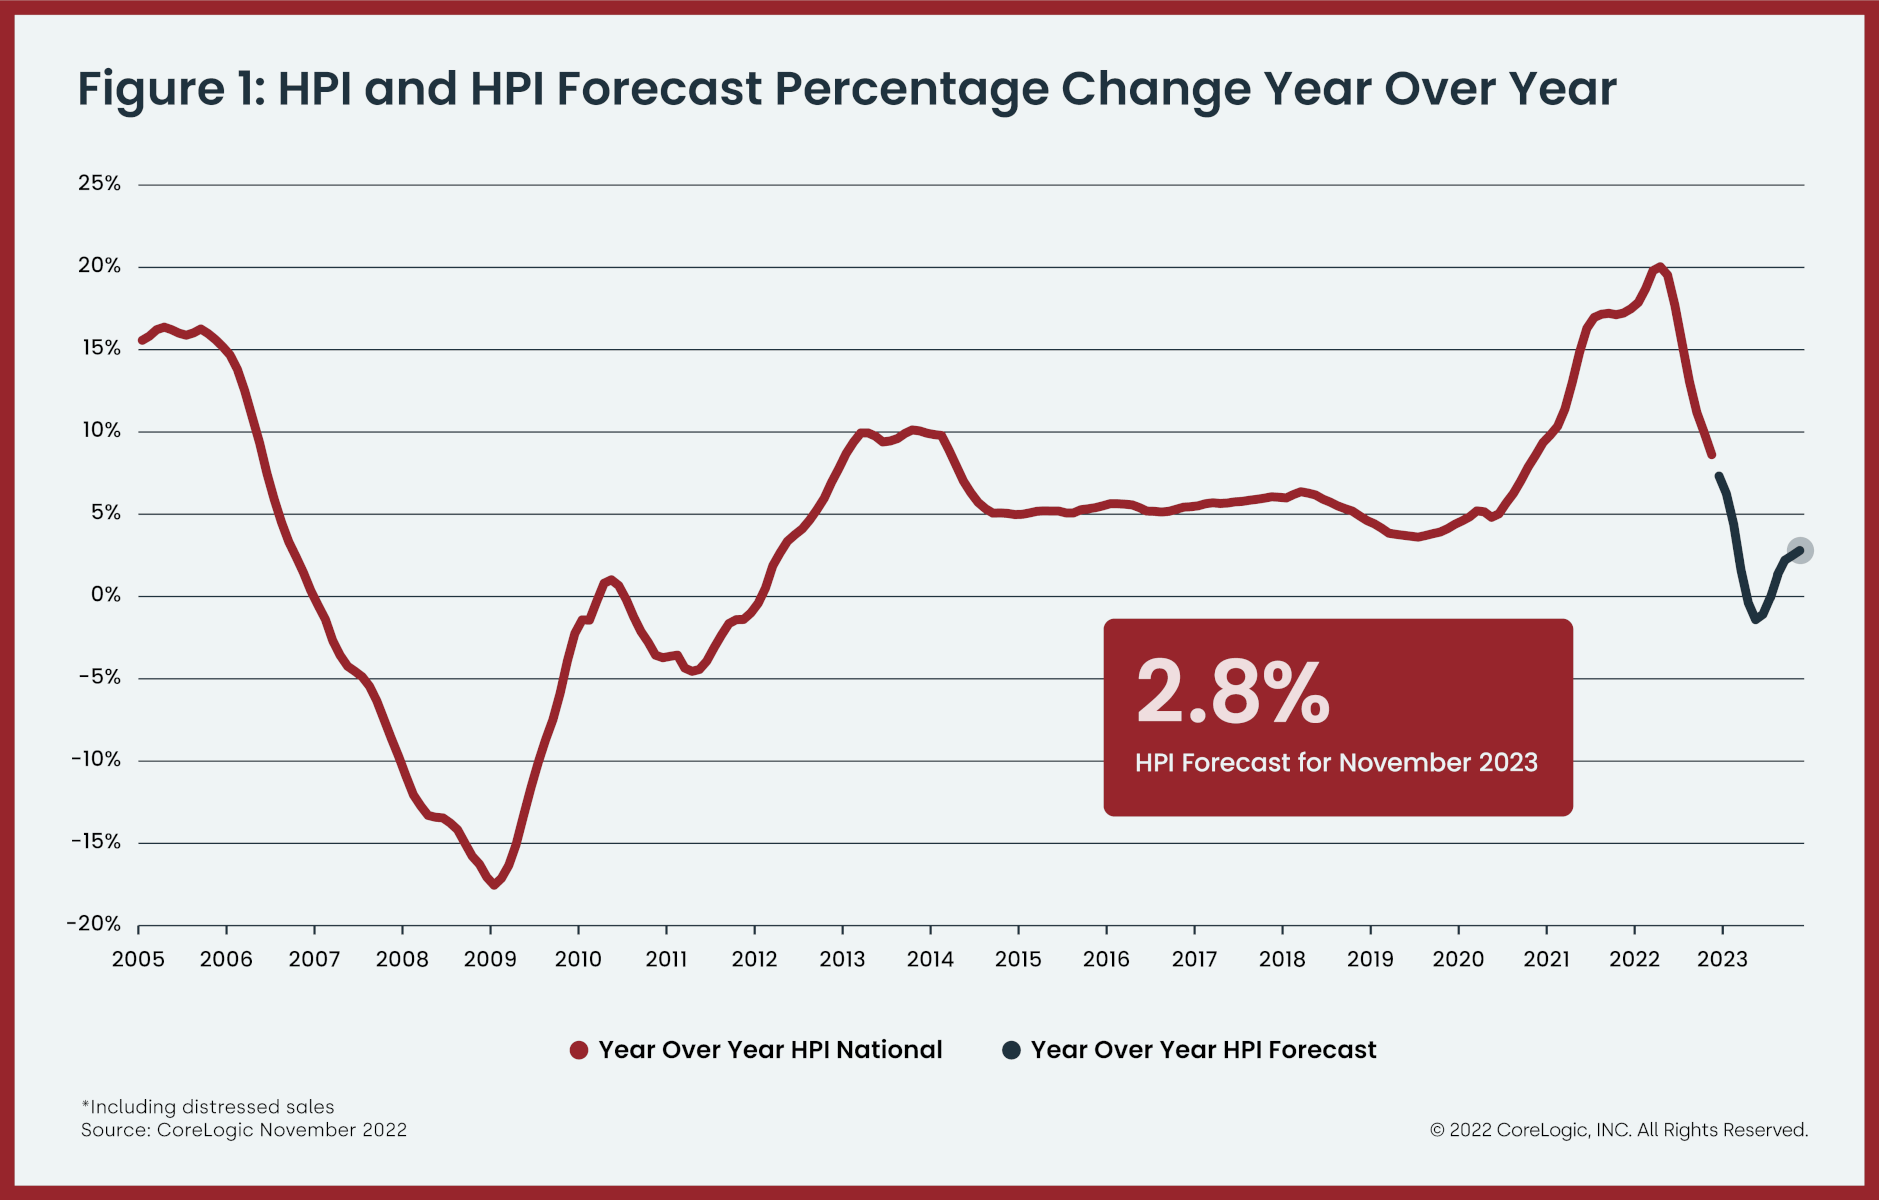
Year-over-year home price growth ended its 21-month streak of double-digit momentum in November, posting an 8.6% gain, the lowest rate of appreciation in exactly two years. Although 16 states bucked the national trend and saw annual double-digit increases, appreciation is decelerating in many popular housing markets across the country. Southeastern states still led the country for price growth in November but also saw some of the most pronounced cooling. Similarly, relatively more expensive Western areas also posted substantial combined declines in recent months since spring’s peak.
Nationwide, the recent price deceleration pushed November home values 2.5% below the spring 2022 peak. In 2023, home values will likely move even further from that high point, as CoreLogic expects price growth to begin recording negative year-over-year readings in the second quarter.
“Although home price growth has been slowing rapidly and will continue to do so in 2023, strong gains in the first half of last year suggest that total 2022 appreciation was only slightly lower than that recorded in 2021,” said Selma Hepp, executive, deputy chief economist at CoreLogic. “However, 2023 will present its own challenges, as consumers remain wary of both the housing market and the overall economic outlook.”
“And while the recent decline in mortgage rates may bode well for the housing market,” Hepp continued, “potential homebuyers are grappling with the idea of buying amid possible further price declines and a continued inventory shortage. Nevertheless, with slowly improving affordability and a more optimistic economic outlook than previously believed, the housing market could show resilience in 2023.”
Top Takeaways:
- U.S. home prices (including distressed sales) increased 8.6% year over year in November 2022 compared to November 2021. On a month-over-month basis, home prices declined by 0.2% compared to October 2022.
- In November, annual appreciation of attached properties (8.8%) was 0.3 percentage points higher than that of detached properties (8.5%).
- Annual U.S. home price gains are forecast to slow to 2.8% by November 2023.
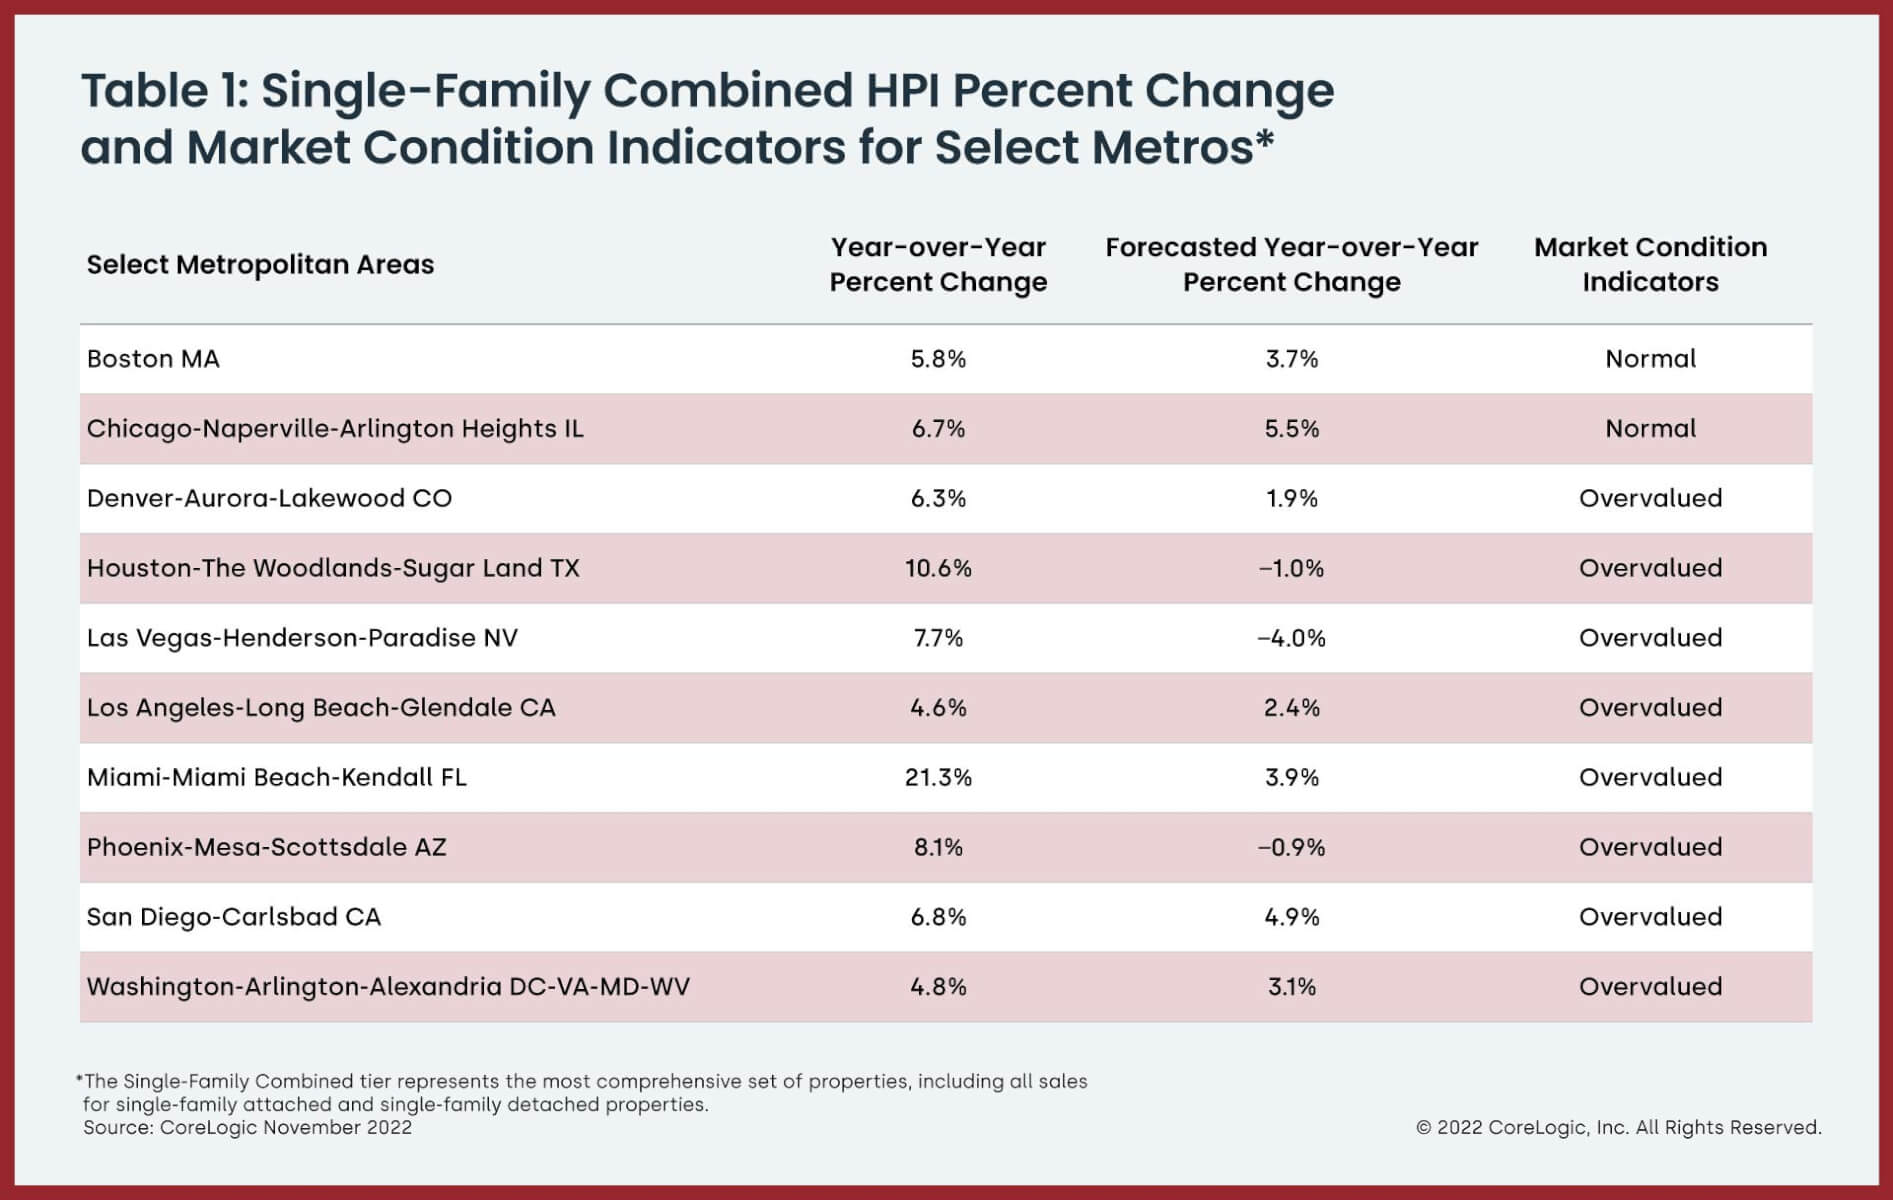
- Miami posted the highest year-over-year home price increase of the country’s 20 largest metro areas in November, at 21.3%, while Tampa, Florida retained the No. 2 spot at 17.3%.
- Florida and South Carolina recorded the highest annual home price gains, 18% and 13.9%, respectively. Georgia posted the third-highest growth, with a 13.6% year-over-year increase. Washington, D.C. ranked last for appreciation at 1.2%.


Methodology
The CoreLogic HPI™ is built on industry-leading public record, servicing and securities real-estate databases and incorporates more than 45 years of repeat-sales transactions for analyzing home price trends. Generally released on the first Tuesday of each month with an average five-week lag, the CoreLogic HPI is designed to provide an early indication of home price trends by market segment and for the “Single-Family Combined” tier, representing the most comprehensive set of properties, including all sales for single-family attached and single-family detached properties. The indices are fully revised with each release and employ techniques to signal turning points sooner. The CoreLogic HPI provides measures for multiple market segments, referred to as tiers, based on property type, price, time between sales, loan type (conforming vs. non-conforming) and distressed sales. Broad national coverage is available from the national level down to ZIP Code, including non-disclosure states.